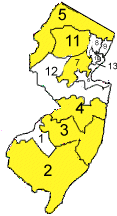
New Jersey
13 seats: 6R, 7D

Where It Ranks Among the
States (House Elections 2000)- Voter Turnout: 33rd (48%)
- Victory Margin: 21st (36%)
Facts in Focus- About 70% of New Jersey's eligible voters
did not vote for the person who represents them in the U.S. House.
The state's representation index is lower than that of 33 other states.
- New Jersey's U.S. House representation closely
mirrors the statewide vote split in House races between Republicans
and Democrats. Republican candidates won 47% of the statewide vote,
and gained 46% of the seats, while Democratic candidates received
50% of the votes and 54% of the seats. The state's redistricting
commission explicitly sought this goal of "proportionality," and the
state's partisan balance indeed has been very sensitive to
relatively small changes in the statewide vote.
- The average margin of victory in New Jersey was
36% -- quite consistent with average margins throughout the decade.
However, the state's 12th district had one of the closest races in the country --
Rush D. Holt (D) won by a margin of .2%.
- 77% of House seats in 2000 were won by
landslide margins of at least 20%. This is a higher "landslide
index" than most states, but still lower than the state's 92%
landslide index in 1994 and the 93% landslide indexes of 1986 and
1988.
- Eight incumbents have won their last three
elections by landslide victory margins.

How New
Jersey ranked in 2000
|