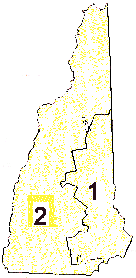
New Hampshire
2 seats: 2R

Where It Ranks Among the
States (House Elections 2000)- Voter Turnout: 7th (61%)
- Victory Margin: 3rd (12%)
Facts in Focus- The average margin
of victory in New Hampshire House races in 2000 was 12%, which is
better than 47 other states. In the 1996 House elections, New
Hampshire had the closest average victory margin in the nation � 5%.
- 43% of the state's voters cast ballots for
Democratic candidates for the U.S. House, yet Republicans won both
U.S. House seats. Democrats' 39% of the statewide vote in 1998, 45%
in 1996, and 38% in 1994 also resulted in no seats. This accounts for the states ranking of
48 in the "seats to votes distortion" rankings. This also
the reason why 43% of votes were "wasted" in 2000, and did
not count towards the election of a representative.
- Only one out of three adults in New
Hampshire voted for the Member of the U.S. House who represents
them.
- Both of New Hampshire's House Members have been
elected since 1992. Charles Bass has won his four races very
narrowly -- with 56% in 2000, 53% in 1998 and 51% in 1996
and 1994. John E. Sununu had an even narrower win this
year with 53% of the vote, a decrease of 13% from
1998.


How New
Hampshire ranked in 2000

|