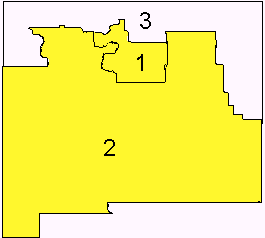
New Mexico
3 seats: 2R, 1D

Where It Ranks Among the
States (House Elections 2000)- Voter Turnout: 34th (47%)
- Victory Margin: 4th (19%)
Facts in Focus- In six elections from 1984 to 1994, 16 of
18 U.S. House races in New Mexico were won by landslide margins of
at least 20%. In 1996-2000, however, only 2 of 11 races (counting two
special elections) was won by landslide.
-
About one in four adults in New
Mexico elected anyone to the U.S. House of Representatives
in 2000 � this is a lower "representation index"
than that of 45
other states. This is the reason why the state has
a percentage of "wasted votes" closer to that of states with
one district (41%).
- Republicans received 47% of the statewide vote
in New Mexico but received 66% of the seats. Democrats also won only
a third of seats in 1996 despite winning a plurality of the vote
that year.
- Third parties earned just 2% of the vote in
2000, but in two special elections in 1997-98, the Green Party won
an average of 16% of the vote. The Greens' relative success has
helped spur many in New Mexico to support instant runoff voting to
allow voters to rank their electoral choices and reallocate the
votes of losing candidates until there is a consensus, majority
winner.


How New
Mexico ranked in 2000

|