


The Shrinking Battleground: The 2008 Presidential Elections and Beyond
Download the report [.pdf - 301 kB] | [ .doc - 545 kB ]
See what others are saying about The Shrinking Battleground:
[Salon.com]
[Election Law]
[The Huffington Post]
[Donkey Rising]
[Rock the Vote]
[Native Unity] (look for August 26, 2005)
Here are some of the key findings:
A shrinking battleground:
- In 1960, 24 states with a total of 327 electoral
votes were battlegrounds. In 2004, only 13 states with 159 electoral
votes were similarly competitive. [See corresponding chart]
- Of potential battleground states, five (Louisiana, Maine, Oregon, Tennessee, West Virginia) grew much less competitive. One (Colorado) grew more competitive.
- Our partisanship model predicted state results within a 2% margin in 32 states. Only two minor states changed their partisanship by more than 3.9%.
Partisan consequences:
- George Bush would have lost the 2004 election if he had won the national popular vote by less than 425,000 votes.
- John Kerry and Democrats did relatively better in battleground states than the nation as a whole and are better positioned if the election is close in 2008.
- 48 of 51 presidential contests went to the same party as in 2000. A shift of just 18,774 votes would have meant an exact repeat of the 2000 state-by-state results.
Civic consequences:
- In the 12 most competitive states in 2004, voter
turnout rose 9% to 63%. In the 12 least competitive states, voter
turnout rose only 2% to 53%.[See corresponding chart]
- Voter turnout among 18-29-year-olds was 64.4% in the ten most competitive states and 47.6% in the remaining states – a gap of 17%.
- More than 30% of whites live in battlegrounds, in
contrast to only 21% of African Americans and Native Americans, 18 % of
Latinos and 14% of Asian Americans. [See corresponding chart]
- A shift of just 20,417 votes would have given the country an Electoral College tie. An even smaller shift would have thrown the 2000 elections into the U.S. House of Representatives.
Charts:

This graph shows the probable number of uncompetitive (black), leaning (pink) and swing (white) electoral votes that would have been available in a competitive presidential race in each election going back to 1960. Over the last several elections the number of swing votes has plummeted.

A comparison of turnout between swing and nonswing states. Residents of competitive states are significantly more likely to vote than citizens in uncompetitive states, especially if they're young.
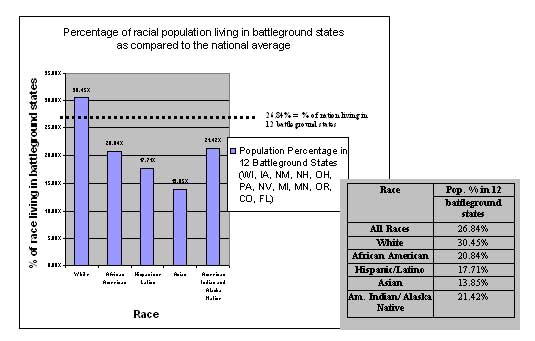
A comparison of the racial makeup of swing and nonswing states. As a rule, a resident of a swing state is significantly more likely to be White than the resident of a nonswing state.