


Monopoly Politics 2006
How by Thursday We Will Project Election ’08 Winners in 340+ Races
On the morning of November 9, 2006 – two days after the mid-term congressional elections – FairVote will issue its projections for winners and electoral margins in the great majority of U.S. House races to be held fully two years later, in November 2008. Even though our projection model represents cautious estimates that reflect how poorly an incumbent might do if he or she has a difficult year (meaning most incumbents will win by greater margins than our cautious projections for them), we expect to be able to project winners in more than 340 U.S. House seats and project landslide wins of at least 20% in nearly half of all seats. Even in fiercely competitive years in which control of the House is in doubt, more than 80% of incumbents can essentially run on cruise control.
We will use the same methodology that has had an accuracy rate of 99.8% in projecting winners in more than 1,600 races from 1996-2004. Based on the history of our success, the candidates we project to win are almost certain to win if they choose to run in 2008, with the only wildcards being their potential involvement in a high-profile personal scandal or a strong swing in the two-party national vote toward the opposition party (note that our spreadsheet allows one to easily adjust the two-party vote to find out what shift would be required to put them into a no-projection category).
Here’s our history of making such bold projections. In July 1997, FairVote first released Monopoly Politics, the first in a series of bi-annual reports that project the outcome of most U.S. House races based on a simple, but powerful observation: the partisan division in most districts usually determines the winner of elections, particularly when combined with a history of strong incumbent performance. In the great majority of U.S. House races, we can project not only who will win but by what margin without knowing a single thing about:
• the identity of their next challenger;
• the incumbent’s voting record or other behavior during their tenure;
• campaign spending in past or current elections;
• district-specific polling data and organizational endorsements.
All we need to know are the results from recent federal elections in the district and the incumbent’s party and seniority. Each Monopoly Politics report provides state-by-state, district-by-district guides to races. The history of elections in each district is included, and winners and victory margins are predicted in the great majority of House races. Our methodology was adapted by analyst Charlie Cook for his well-known “partisan voting index” (PVI) measurement of districts.
Because we lack the presidential election data by district immediately after congressional elections held at the same time as presidential elections, our projections for mid-term congressional elections are delayed until that data is available. But after mid-term elections, the only new data we need to make projections is the incumbent’s performance in that mid-term election. Heading into 2008, therefore, the only changes we will make after November 9, 2006 are: (1) final official election results by district, which occasionally can affect a projection; (2) whether the seat becomes open, which then triggers projections based on the district partisanship without regard to past congressional candidate performance in the district; (3) whether the district lines are changed, as took place in Texas in 2003 and Georgia in 2005; and (4) and the projected two-party national division in the next election, which automatically changes projections in all races.
Our predictions of winners in House elections have been remarkably accurate since we launched the model. Although there likely were slight deviations from a 50-50 partisan division in some of those elections – a slight advantage for Democrats in 1998, for example, and a somewhat bigger advantage for Republicans in 2002 – we have evaluated our projections based on a 50-50 vote. During that period, we have projected winners in 1,613 races. Of these projected winners, 1610 (99.8%) indeed did win the seat. Although two of the three errors were in 2004 (Republican Phil Crane’s defeat in Illinois and Democrat John Salazar’s open seat win in Colorado), our projections for landslide winners were remarkably accurate that year: of the 211 races we projected would be won by landslide margins of 20%, all but two were in fact won by that margin. Indeed the most striking trend in our analysis has been the increase in seats projected to be won and won easily – a trend that has closely tracked a general decline in competitiveness in elections.
See the following chart for more details. Note that for 2006 we have three different listings, based on three different potential two-party results: ones where Democrats win 50%, 53% and 56% of the two-party vote, respectively.
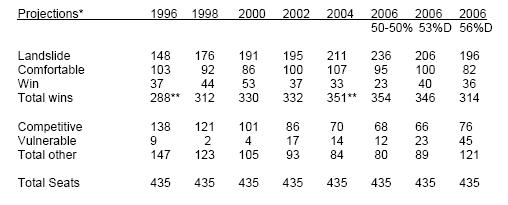
* 1996-2000 projections made retroactively after converting to a new spreadsheet-driven model in 2002
** One of our projected winners lost in 1996. Two lost in 2004. All the others won their elections.