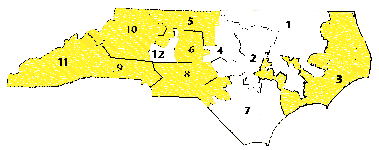
North Carolina
12 seats: 7R, 5D

Where It Ranks Among the States (House Elections 2000)- Voter Turnout: 32nd
(48%)
- Victory Margin: 25th (37%)
Facts in Focus- The state legislature drew
a new redistricting plan after the 1996 elections because of a
lawsuit against a black-majority district. In the previous plan, at
least two races were won by less than 10% in each election, and
the average victory margin was 24%. In the new plan, drawn
explicitly to protect incumbents, no races were won by less than 10%, and the
average victory margin jumped to 35% in 1998.
- Only 32% of adults in North Carolina voted for
the person who represents them in the U.S. House. The state's
"representation index" was 28% in 1996 (a presidential year) and
just 18% in 1994.
- Seven seats have changed party control in the
36 House races in 1994-1998 � a higher rate of
change than in most states. However, in 2000 there was no change in seat
distribution
- In 1982-1990, white men won all 55 House races.
Since the 1991-1992 redistricting, black candidates have won two
seats in each election, and women have won two seats in each of the
elections from
1994-2000.
- Three incumbents have won all five elections in
1992-2000 by landslide.


How
North Carolina ranked in 2000

|