U.S. National Profile
435 Seats: 202R, 233D
National Rankings 2006
National Rankings 2006
| Democracy Index | NA | Representation | 25.6% | ||||||||||||||||||||||
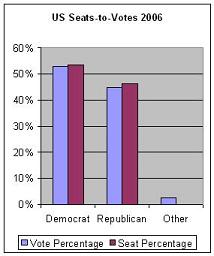
| Margin of Victory | 38.8% | Seats-to-Votes | 1.2% | ||||||||||||||||||||||
| Landslide Index | 73.1% | House Turnout | 42.4% |


| 1992 | 1994 | 1996 | 1998 | 2000 | 2002 | 2004 | 2006 | |
| Democracy Index | NA | NA | NA | NA | NA | NA | NA | NA |
| Voter Turnout | 52% | 36.6% | 45.6% | 32.8% | 47.3% | 38.4% | 57.8% | 42.4% |
| Representation Index | 31.8% | 23.4% | 28.7% | 22.1% | 31.2% | 23.5% | 37.9% | 25.6% |
| Wasted Votes | 38% | 36% | 37% | 33% | 33% | 32.7% | 31.9% | 35.2% |
| % Of Wasted R / D Votes | 42 / 29 | 31 / 39 | 31 / 40 | 28 / 33 | 26 / 35 | 25 / 35 | 25 / 37 | 32 / 36 |
| Drop-Off Voters | 9.1% | 6.0% | 6.9% | 9.1% | 7.6% | 5.6% | 8.6% | 3.8% |
| Avg Margin of Victory | 30.5% | 34.4% | 30.4% | 42.6% | 39.9% | 42.5% | 40.5% | 38.8% |
| Votes for (R-D-O%) | 45-51-4 | 52-45-2 | 49-49-3 | 49-48-3 | 48-48-4 | 51-46-3 | 50-48-2 | 45-53-2 |
| Seats for (R-D-O%) | 41-59-0.2 | 53-47-0.2 | 52-48-0.2 | 51-49-0.2 | 51-49-0.4 | 53-47-0.2 | 53-46-0.2 | 46-54-0 |
| Seat Changes | 49 | 60 | 34 | 17 | 17 | -- | 13 | 22 |
| High % Turnout, District | -- | 60 (MN-6) | 77 (MN-6) | 78 (MN-3) | 91 (MN-6) | -- | -- | -- |
| Low % Turnout, District | -- | 10 (NY-12) | 15 (CA-33) | 12 (CA-33) | 17 (CA-33) | -- | -- | -- |
Election Results and Analysis: 1994-2006
| Results 1994-2006 | 1994 | 1996 | 1998 | 2000 | 2002 | 2004 | 2006 |
| U.S. House (R-D-O) | 230-204-1 | 227-207-1 | 223-211-1 | 221-212-2 | 229-205-1 | 232-202-1 | 202-233-0 |
| Landslide Index | 63% | 64% | 73% | 77% | 81.8% | 82.5% | 73.1% |
| Scale of Competitiveness | |||||||
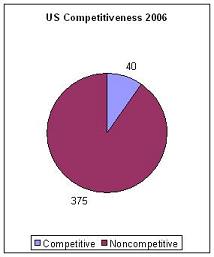
| Tight: < 5 | 51 | 40 | 17 | 19 | 23 | 10 | 35 |
| Competitive: 5-10 | 36 | 40 | 26 | 23 | 15 | 13 | 25 |
| Comfortable: 10-20 | 72 | 76 | 74 | 57 | 41 | 53 | 57 |
| Landslide: 20-40 | 133 | 161 | 134 | 163 | 156 | 192 | 168 |
| No Contest: 40+ | 108 | 101 | 90 | 109 | 120 | 102 | 95 |
| Uncontested | 35 | 17 | 94 | 64 | 80 | 65 | 55 |
| Incumbents | |||||||
| Total Running / Total Seats | 383 / 435 | 382 / 435 | 401 / 435 | 403 / 435 | -- | -- | 402 / 435 |
| Re-Election / Total Incumbent | 349 / 383 | 361 / 382 | 395 / 401 | 397 / 403 | -- | -- | 379 / 402 |
| Landslide / Total Incumbent | 256 / 383 | 260 / 382 | 306 / 401 | 333 / 403 | -- | -- | 301 / 402 |
| R. Landslide / R. Incumbent | 140 / 157 | 135 / 212 | 163 / 207 | 163 / 213 | - | -- | 120 / 189 |
| D. Lamdslide / D. Incumbent | 116 / 225 | 125 / 169 | 142 / 193 | 170 / 190 | -- | -- | 181 / 192 |
| Untouchable Repeat Landslide | 193 | 223 | 241 | 285 | -- | -- | 257 |
| Uncontested Primary | 204 | 252 | 281 | 274 | -- | -- | -- |
| Elected Women | 47 | 51 | 58 | 59 | -- | -- | 69 |
| Elected Racial Minorities | 38B 17L 4A | 37B 20L 4A | 37B 17L 3A | 37B 19L 4A | -- | -- | 38B 23L 5A 1AI |
Election Results and Analysis: 1982-1992
| Results 1982-1992 | 1982 | 1984 | 1986 | 1988 | 1990 | 1992 |
| U.S. House (R-D-O) | 166-269-0 | 182-253-0 | 177-258-0 | 175-260-0 | 167-226-1 | 176-258-1 |
| Landslide Index | 69% | 75% | 81% | 85% | 74% | 61% |
| Scale of Competitiveness | ||||||
| Tight: < 5 | 35 | 30 | 25 | 19 | 33 | 52 |
| Competitive: 5-10 | 35 | 24 | 18 | 11 | 20 | 32 |
| Comfortable: 10-20 | 66 | 55 | 41 | 42 | 59 | 85 |
| Landslide: 20-40 | 136 | 131 | 115 | 137 | 165 | 153 |
| No Contest: 40+ | 144 | 151 | 187 | 180 | 109 | 105 |
| Uncontested | 19 | 44 | 49 | 46 | 49 | 8 |
| Incumbents | ||||||
| Total Running / Total Seats | 383 / 435 | 409 / 435 | 391 / 435 | 408 / 435 | 406 / 435 | 350 / 435 |
| Re-Election / Total Incumbent | 354 / 383 | 393 / 409 | 385 / 391 | 402 / 408 | 391 / 406 | 326 / 350 |
| Landslide / Total Incumbent | 268 / 383 | 319 / 409 | 332 / 391 | 359 / 408 | 309 / 406 | 227 / 350 |
| R. Landslide / R. Incumbent | 89 / 215 | 133 / 155 | 123 / 159 | 139 / 163 | 111 / 156 | 92 / 139 |
| D. Lamdslide / D. Incumbent | 179 / 215 | 186 / 254 | 209 / 232 | 220 / 245 | 198 / 250 | 134 / 210 |
| Untouchable Repeat Landslide | 204 | 244 | 270 | 312 | 270 | 186 |
| Uncontested Primary | 245 | 249 | 262 | 291 | 275 | 178 |
| Elected Women | 21 | 22 | 23 | 25 | 28 | 47 |
| Elected Racial Minorities | 19B 8L 3A | 18B 11L 3A | 21B 11L 3A | 22B 10L 4A | 25B 10L 2A | 38B 17L 4A |