Democrats� National Majorities and Comparisons to Past Elections
On November 7th, Americans elected all 435 Members of the U.S. House of Representatives and 33 U.S Senators. The Democrats won clear majorities of U.S. House and U.S. Senate seats, which translated into a razor-thin majority in the Senate and a more comfortable majority in the House. There are different ways to measure these majorities and how they compare with previous elections, but one consistent fact is that our electoral systems do not guarantee that a party obtaining a majority of the national House or Senate vote will get a majority of seats.
Minority Rule in the U.S. Senate
Our state-based method of electing U.S. Senators creates opportunities for extremely distorted representation. When states have two senators regardless of size, it is easy to have such a disconnection. Due to such malapportionment (which, while required for Senate elections by the U.S. Constitution, is not permitted for any other public election in the United States) and the vagaries of single-member district elections, there is little guarantee that the Senate will reflect popular sentiment.
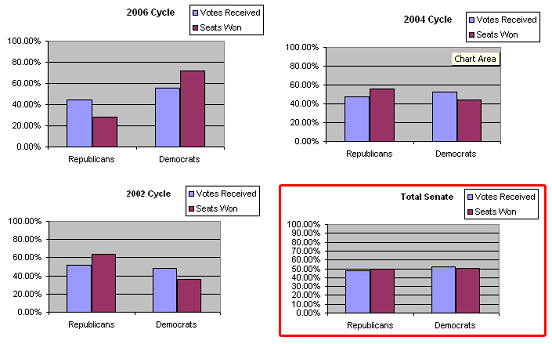
In every election cycle determining the Senators in the coming 110th Congress the parties did not receive a number of seats proportional to the number of votes they received. For example, in the 2002 cycle, Republicans received a whopping 63.64% of the Senate seats up for election that year, while only receiving a bare majority of 52.11% of the vote nationally. This situation was even worse for Democrats in 2004, as their candidates received an actual majority of votes with 52.22% nationally, only to see Republicans get 55.88% of seats that year. This year, it was the Republicans who suffered from skewed representation, as they lost six seats and went from holding 55 of 100 Senate seats to a minority 49 seats. Democrats received 55.66% of the national Senate vote, but this resulted in that party receiving an overwhelming 71.88% of seats that year. Hence, both parties can be victims of the Senate�s skewed representation.
Ironically, the back and forth of the skewed representation will result in the 110th Congress being fairly well-matched, with each party earning a share of seats fairly proportional to its share of the vote over the three election cycles comprising the 110th Senate. But what�s striking is that the total share of the Republican popular vote in 2002-2006 was 47.66% -- compared to having won 49.48% of all votes cast in Senate races in 2000-2004, after which they held their majority. With a swing of 267 votes in South Dakota in 2002 or 3,616 in Virginia this year, Republicans could have continued to control the Senate, while not having a support of the majority of the electorate in the last 100 Senate races.

Measuring two-party performance in the U.S. House of Representatives
The party whose House candidates together win a majority of votes nationally can still fail to win a majority of House seats, as nearly happened in the late 1990s. But counting all votes cast for U.S. House candidates in the 2006 cycle, the Democrats received a national boost, as their 51.1% of votes translated into receiving a disproportionate 53.6% of seats. Republicans won a fairly proportional 46.4% of seats with 46.6% of all votes cast. The remaining 2.3% of votes went to independent and third party candidates, who won no seats.
In reality though, in the 2006 cycle, the actual Democratic national vote share was 52% to the Republicans� 48%. FairVote determined this by measuring the underlying two-party vote based on factoring in relative �incumbency bumps� (see appendix) that avoid distortions that can occur when one party runs more incumbents or when uncontested candidacies can warp the national numbers.
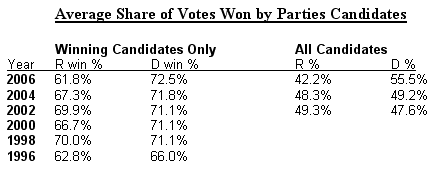
Some analysts have noted that the average percentage of the vote per district for all Democratic candidates was 55%. This in fact is not as revealing as it may seem, noting that over the years, Democrats consistently do relatively better than Republicans in average vote shares. This is because Democrats have a big edge in the number of seats won by overwhelming margins, due to how their dominance in many urban areas far outstrips Republican dominance of their strongholds.

Minority Rule & Wrong Winners in the States
In 2006, there were six states where the parties with most votes did not win majorities of U.S. House seats: Indiana, Iowa, Michigan, Nevada, New Mexico and Ohio. The most glaring cases were Michigan and Ohio.
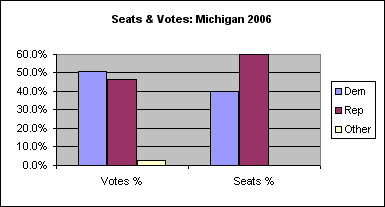
In Michigan, Democrats won only six of 15 seats with 51% of overall votes statewide. Republicans captured nine of 15 seats with 46.3%.

In Ohio, Republicans won 11 of 18 seats with only 47.8% of overall votes. Democrats won only seven seats despite winning 52% of votes across the state.
There were four other cases in which the party with a vote plurality won one fewer seat than the runner-up party.
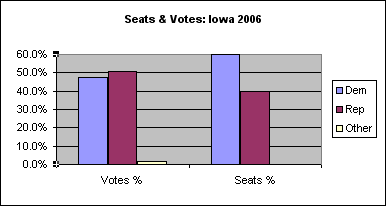
In Iowa, Democrats captured 3 of 5 seats despite winning only 47.7% of votes statewide. Republicans won a 50.6% majority of overall votes, yet they won only two seats.

Democrats won five of 9 seats in Indiana despite trailing Republicans by 0.1% of the popular vote. The split was 48.8% to 48.9%.
In Nevada, Republicans won two of three seats with only 45.3% of votes. Democrats had 50.1%.
Finally, in New Mexico, Democrats won only one of three seats with 55.8% of the statewide popular vote. Republicans won two seats � a majority of the delegation despite having won only 44.2% of votes.