|
|
2004 U.S. House Elections
Voting Age Population: |
Presidential Vote | - 2004: 221,257,000
- 2004 Voting Eligible: 201,210,315
- 2002: 214,726,000
- 2000: 205,815,000
- 1998: 200,515,000
|
- 2004: Kerry 48, Bush 51, Nader 1
- 2000: Gore 48, Bush 48, Nader 3
- 1996: Clinton 49, Dole 41, Perot 7
U.S. House: 232 R, 202 D, 1 Ind
Party Seat Changes 2004: 13
House Districts: 435
|
Fairness of 2004 Elections
Democracy Index: N/A
| Seats-to-Votes Distortion: 2.1%
| Margin of Victory: 37.4%
| Representation Index: 37.9%
| Landslide Index: 82.5%
| Voter Participation: 57.8%
|
For definitions of terms, please see this report's glossary page.
  Democracy Index: 2002-2010
| | 2002
| 2004 | 2006 | 2008 | 2010 | | Democracy Index | NA | NA |
| | | Voter Turnout
| 38.4% | 57.8% | | | | Representation Index
| 23.5% | 37.9% | | | | | | | | | | | Wasted Votes
| 32.7% | 31.9% | | | | % of Wasted R / D Votes
| 25 / 35 | 25 / 37
| | | | Drop-Off Voters
| 5.6% | 8.6% | | | | | Avg. Margin of Victory | 42.5% | 40.5% | | | |
| | | | | | Votes for (R-D-O%)
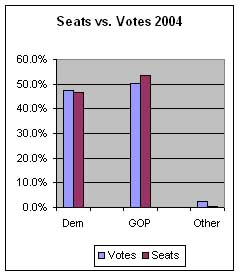
| 50.9-46.0-3.1
| 50.1-47.5-2.4 | | | | | Seats for (R-D-O%) | 52.6-47.1-0.2
| 53.3-46.4-0.2
| | | | | Seat Changes | 38 | 13 | | | | | High % Turnout, District | ---- | ----
| | | | | Low % Turnout, District | ---- | ---- | | | |
Democracy Index: 1992-2000
| | 1992 | 1994 | 1996 | 1998 | 2000 | Democracy Index
| NA | NA
| NA | NA | NA | Voter Turnout
| 52% | 36.6% | 45.6% | 32.8% | 47.3% | Representation Index
| 31.8% | 23.4% | 28.7% | 22.1% | 31.2% | | | | | | | | Wasted Votes
| 38% | 36% | 37% | 33% | 33% | % of Wasted R / D Votes
| 42 / 29
| 31 / 39 | 31 / 40 | 28 / 33 | 26 / 35
| Drop-Off Voters
| 9.1% | 6.0%
| 6.9% | 9.1% | 7.6% | Avg. Margin of Victory
| 30.5%
| 34.4% | 30.4% | 42.6% | 39.9% | | | | | | | | Votes for (R-D-O %)
| 45.4-50.8-3.8 | 52.4-45.4-2.2 | 48.9-48.6-2.5 | 49.1-47.9-3.0 | 48.2-47.9-3.9 | | Seats for (R-D-O %) | 40.5-59.3-0.2 | 52.9-46.9-0.2 | 52.2-47.6-0.2 | 51.3-48.5-0.2 | 50.8-48.7-0.4 | Seat Changes
| 49 | 60 | 34 | 17 | 17 | High % Turnout, District
| ---- | 60 (MN-6, OR-6)
| 77 (MN-6)
| 78 (MN-3)
| 91 (MN-6)
| Low % Turnout, District
| ---- | 10 (NY-12)
| 15 (CA-33)
| 12 (CA-33)
| 17 (CA-33)
|
Election Results & Analysis: 2002-2010
RESULTS 2002-2010
| 2002
| 2004 | 2006 | 2008 | 2010 | U.S. House (R-D-O)
| 229-205-1
| 232-202-1 | | | | Lanslide Index
| 81.8%
| 82.5% | | | | SCALE OF COMPETITIVENESS
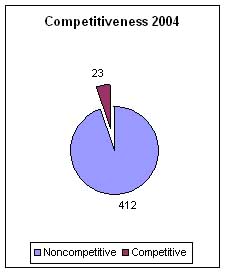
| | | | | | | Tight: < 5 | 23
| 10 | | | | Competitive: 5-10
| 15
| 13
| | | | Comfortable: 10-20
| 41
| 53 | | | | Landslide: 20-40
| 156
| 192
| | | | | No Contest: 40+ | 120
| 102
| | | | Uncontested
| 80
| 65
| | | | INCUMBENTS
| | | | | | Total Running / Total Seats
| 390 / 435 | 400 / 435 | | | | Re-Election / Total Incumbent
| 382 / 390
| 393 / 400
| | | | Landslide / Total Incumbent
| 335 / 390*
| 340 / 400* | | | | R. Landslide / R. Incumbent
| 179 / 200
| 174 / 207 | | | | D. Landslide / D. Incumbent
| 156 / 189 | 165 / 192 | | | | Untouchable
| 253
| 286
| | | | Uncontested Primary
| 255
| 283
| | | | Elected Women
| 59
| 64
| | | | Elected Minorities
| 37B, 21L, 3A
| 40B, 25L, 3A
| | | |
*There were four incumbent on incumbent match-ups in 2002. Only four incumbents lost to challengers. In 2004 there were two incumbent-on-incumbent match-ups. Only five incumbents lost to challengers.
Election Results & Analysis: 1992-2000
RESULTS 1992-2000
| 1992
| 1994
| 1996
| 1998
| 2000
| | U.S. House (R-D-O) | 176-258-1 | 230-204-1 | 227-207-1 | 223-211-1 | 221-212-2 | Landslide Index
| 61% | 63%
| 64%
| 73%
| 77% | SCALE OF COMPETITIVENESS
| |
| | | | Tight: < 5
| 52 | 51 | 40
| 17 | 19 | Competitive: 5-10
| 32
| 36
| 40
| 26 | 23 | Comfortable: 10-20
| 85
| 72
| 76
| 74 | 57 | Landslide: 20-40
| 153
| 133
| 161
| 134 | 163 | No Contest: 40+
| 105
| 108
| 101
| 90 | 109 | Uncontested
| 8
| 35
| 17
| 94 | 64 | INCUMBENTS
| | | | | | Total Running / Total Seats
| 350 / 435
| 383 / 435
| 382 / 435
| 401 / 435 | 403 / 435 | Re-Election / Total Incumbent
| 326 / 350
| 349 / 383
| 361 / 382
| 395 / 401 | 397 / 403 | Landslide / Total Incumbent
| 227 / 350
| 256 / 383
| 260 / 382
| 306 / 401 | 333 / 403 | R. Landslide / R. Incumbent
| 92 / 139
| 140 / 157
| 135 / 212
| 163 / 207 | 163 / 213 | D. Landslide / D. Incumbent
| 134 / 210
| 116 / 225 | 125 / 169
| 142 / 193 | 170 / 190 | Untouchable
| 186
| 193
| 223
| 241 | 285 | Uncontested Primary
| 178
| 204
| 252
| 281 | 274 | Elected Women
| 47
| 47
| 51
| 58 | 59 | Elected Minorities
| 38B, 17L, 4A
| 38B, 17L, 4A | 37B, 20L, 4A
| 37B, 17L, 3A | 37B, 18L, 4A |
Election Results & Analysis: 1982-1990
RESULTS 1982-1990
| 1982
| 1984
| 1986
| 1988
| 1990
| U.S. House (R-D-O)
| 166-269-0
| 182-253-0 | 177-258-0 | 175-260-0 | 167-226-1 | Landslide Index
| 69% | 75% | 81% | 85% | 74% | SCALE OF COMPETITIVENESS
| | | | | | Tight: < 5
| 35 | 30 | 25 | 19 | 33 | Competitive: 5-10
| 35 | 24 | 18 | 11 | 20 | Comfortable: 10-20
| 66 | 55 | 41 | 42 | 59 | Landslide: 20-40
| 136 | 131 | 115 | 137 | 165 | | No Contest: 40+ | 144 | 151 | 187 | 180 | 109 | Uncontested
| 19 | 44 | 49 | 46 | 49 | INCUMBENTS
| | | | | | Total Running / Total Seats
| 383 / 435 | 409 / 435 | 391 / 435 | 408 / 435 | 406 / 435 | Re-Election / Total Incumbent
| 354 / 383 | 393 / 409 | 385 / 391 | 402 / 408 | 391 / 406 | Landslide / Total Incumbent
| 268 / 383 | 319 / 409 | 332 / 391 | 359 / 408 | 309 / 406 | R. Landslide / R. Incumbent
| 89 / 215 | 133 / 155 | 123 / 159 | 139 / 163 | 111 / 156 | D. Landslide / D. Incumbent
| 179 / 215
| 186 / 254 | 209 / 232 | 220 / 245 | 198 / 250 | Untouchable Repeat Landslide
| 204
| 244 | 270 | 312 | 270 | Uncontested Primary
| 245
| 249 | 262 | 291 | 275 | Elected Women
| 21 | 22 | 23 | 25 | 28 | Elected Minorities
| 19B, 8L, 3A
| 18B, 11L, 3A | 21B, 11L, 4A | 22B, 10L, 4A | 25B, 10L, 2A |
|
|

