Welcome to our 2003 release of Dubious Democracy. For comparison, please visit our 2001 report and our Monopoly Politics reports from 2002 and 2004. You can also access state-level analyses of Massachusetts and Texas.
We believe presenting this information effectively is extremely important. There is a disturbing and powerful message in the array of numbers in this report. We hope all visitors to this site will leave it with a better understanding of U.S. House elections -- and why democracy as practiced in elections to the U.S. House of Representatives has indeed become all too "dubious."
The report features state-by-state statistics on U.S. House elections from 1982 to 2002. It has important information on voter participation and on the degree of competition - or lack thereof - in states over this period of time. Below are links to each state and to our national summary pages. Please contact us by email or phone at 301-270-4616 you have any questions.
Overview
Generally, the first year
after redistricting results in the most competitive House elections of
the decade. After the most recent redistricting, there were fewer
competitive races than in the least competitive year of the decade from
1992-2000.
This problem -- a lack of competitive elections -- is only going to get worse from 2004 to 2010.
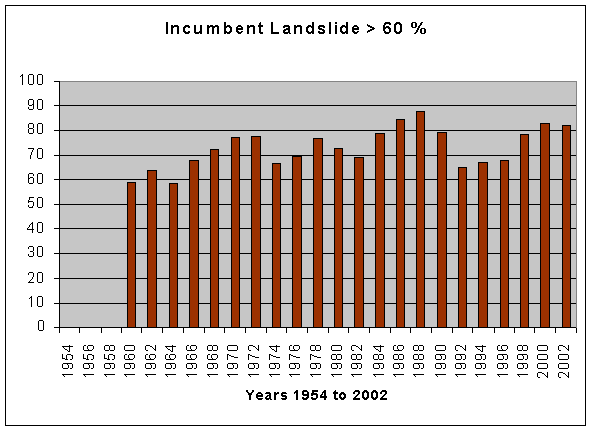
In 2002, over 80% of US House races were won by landslide margins of at
least 20%. Fewer than one in ten races were by less than a 10%
margin. This year’s elections were the least competitive races
since 1988.
The first year after redistricting is generally the most competitive
year of the decade. For example, in 1992 there were 84
competitive races, and 61% of the races were won by landslides.
As incumbents settle into their districts throughout the course of the
decade, elections generally become less competitive. In 2000,
there were only 42 competitive races, half as many as in 1992, and 77%
were won by landslide margins of at least 20%.
This has a chilling implication for the decade ahead of us:
It’s likely that the most competitive year of 2002-2010 will be less competitive than the least competitive year of 1992-2000.
If you’re dismayed that growing numbers of eligible Americans are
choosing not to vote, you may not want to continue reading, because
it’s only going to get worse unless we start making fundamental changes
in the way we hold elections and elect our representatives.
Over 90% of Americans live in congressional districts that are
essentially one-party monopolies. This means that most voters are
faced with unappealing choices: ratify the incumbent party, waste
their vote on a candidate who is sure to lose, or sit out the
race. Not surprisingly, increasing numbers of American are opting
for the latter option.
So much for a healthy two-party system, where issues ignored by one
major party can be meaningfully addressed by the other one. And
if you’d like to hear about the policy ideas of independent and third
party candidates, you’re even more out of luck.
Instead, we’ve got to face a very troubling electoral landscape:
* The average victory margin in U.S. House races was 39% -- meaning
winners on average won more than 69% of votes cast in their race. Only
38, fewer than one in ten races, were won by competitive margins of
less than 10%.
* The landslide index increased to 81%, meaning more than four out of
five races were won by more than 20%. Since 1960, only one year,
1988, had a higher landslide index.
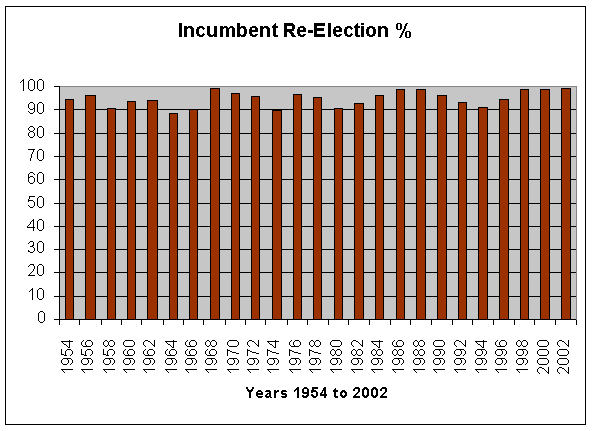
* Only 4 out of 386 incumbents lost to facing non-incumbent
challengers. That’s the highest re-election rates since 1954 (and
possibly earlier), at a time when public opinion of the Congress is not
very flattering.
* Nearly three out of five seats (254) are held by incumbents who have
won their last two elections by “landslide” margins of least 20%
(earning our "untouchable" tag).
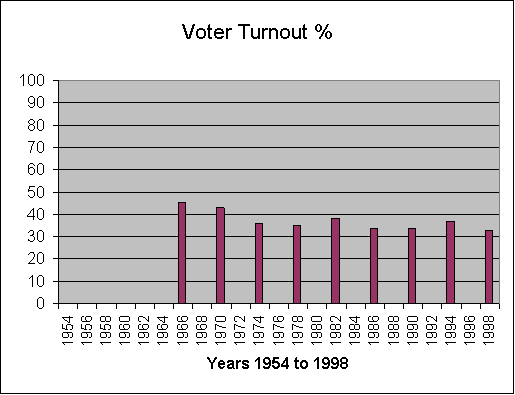
* Less than 39% of eligible Americans cast a vote in 2000; only one in
four adults voted for the U.S. House member who represents them.
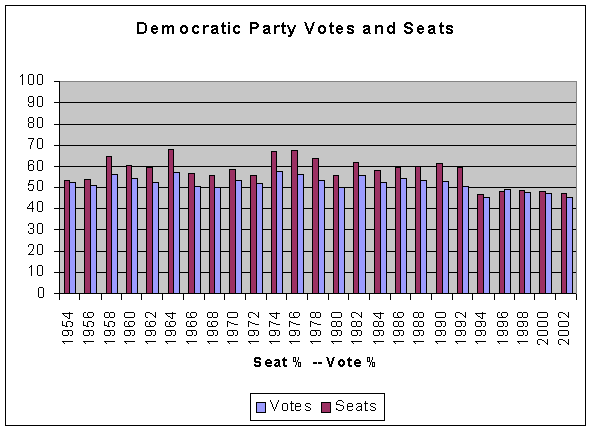
* Republican candidates for the House in 1992 won 45% of votes around
the country, but only 41% of seats. In 2000, they won 48% of votes, but
51% of seats. Such swings and distortions are often magnified in
particular states.
It’s time to stop blaming the victims of the American electoral system
– the voters – and start addressing the root causes of feelings of
alienation and lack of representation.
The Center for Voting and Democracy advocates for full representation,
instant runoff voting and public interest redistricting methods to
improve representation and accountability, increase competition,
enhance debate of issues and ultimately improve public policy and
national unity.
Read the rest of the Dubious Democracy 2003 report for disturbing information about the state of our democracy.
Minority Rule:
How many Americans voted for a majority of Congress?
A majority of Congress is 218 seats.
The 218 members of Congress winning with the smallest number of votes
received a total of 20.6 million votes out of a total of 73.4 million
cast.
In other words, 28% of the votes cast for US Congress were able to
elect a majority of the seats. These people constitute about 10%
of the eligible adult population.
If we just look at the 218 Republicans who received the lowest number
of votes, the number of people voting for the ruling majority rises to
26.8 million votes, or 36% of total votes cast. This is less than
15% of the eligible adult population.
Acknowledgements: This analysis was graciously performed by an
advocate for fair elections. If you would like to communicate with the
analyst, please send a note to [email protected] and we will forward
it.
We have similar statistics for congressional elections for 2000 and for many state legislatures.
NOTE: 2002 primary (and runoff primary) and general election data
for U.S. Reps and U.S. Senators will be published by the FEC shortly at
http://www.fec.gov/elections.html.
ALL houses of ALL State legislatures have ANTI-Democracy math like that of the U.S. House of Reps.
Data and methodology
Complete data set and methodology, including a template for conducting dubious democracy analyses of state legislative elections and links to official US House results.
Ranking the States (see left column)
- Turnout
- Representation Index
- Landslide Index
- Average Margin of Victory
- Seats to Votes Distortion
- Democracy Index
State Profiles
U.S. House of Representatives 1954 to present
Notes:
* 4 incumbents lost to non-incumbent challengers in 2002. 4 other incumbents lost to other incumbents in races that pitted 2 incumbents against each other as a result of redistricting. 99.0% represents 382 wins out of 386 races.
# Based on 20% victory margins rather than winning 60% of the vote.
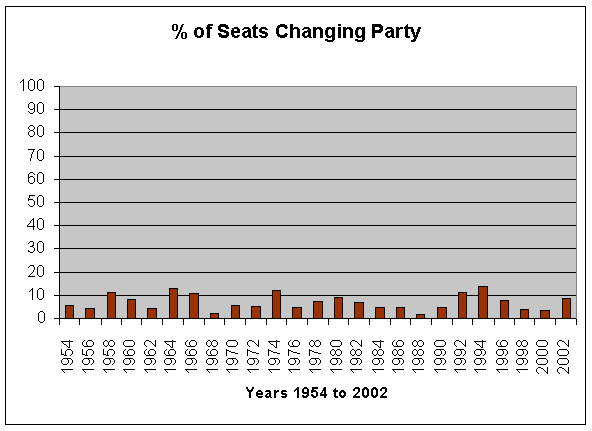
+ Due to reapportionment, 8 states gained seats and 10 lost seats. Those gains and losses contributed to 24 seat changes. Another 14 seats switched from 1 party to the other.
- Incumbents with landslides over 60%
- Incumbent
Re-Election % Chart
- % of Seats Changing Party Chart
- Democratic Party Votes and Seats Chart
- Voter Turnout % Chart
Facts
in Focus
Revealing statistics about the U.S. and a few individual states.
* Barely three in ten adults in the United States voted for the person who represents them in the U.S. House of Representatives.
* The number of U.S. House races not contested by both major parties was 80, almost 18%.
* The share of U.S. House seats won by "landslide" margins jumped from 64% in 1996 to 77% in 2000 to 81% in 2002, the highest percentage since 1988.
* The average victory margin was 39% -- meaning that the average two-party race was won by 69%-31%. Fewer than one in ten races were won by competitive margins of less than 10%. This marks a sharp decline from the post-redistricting elections in 1992-1996, but is comparable towards the end of the 1990s and 1980s.
* The overall share of seats won by the major parties closely matched their national vote share -- but masked large distortions in several states, where one party won a far greater share of seats than its share of the vote. See, for examples, the states of Nebraska and Massachusetts, where one party won 100% of the seats.
* Third parties received 3% of the national vote. This would result in 17 seats in U.S. House seats in a proportional system, but there are no third party members and only one independents in Congress in 2003-2004.
* The number of women House members was 58, no higher than the last 2 elections, still only 14% of seats.
* The number of racial and ethnic minorities in the U.S. is stalled at 60, far less than their share of the general population.
