Sheryl Seckel
The 1991-1992 round of redistricting had a significant impact on the competitiveness of congressional elections in 1992 and 1994 -- an impact likely to continue until 2002. An important, if unsurprising, finding is that the degree of electoral competition a state experiences is related to whether redistricting statutes were passed when a state was a one-party monopoly or had a government divided between the two parties.
An analysis of the three elections to the House of Representatives from 1990-1994 reveals a direct correlation between partisan control and competitiveness when measuring competitiveness by the number of House races won with less than 55% of the vote: the more one party controlled redistricting, the less competitive the House races.
For example, in the seventeen states where one party had control of the governorship and both legislative chambers during the 1991-1992 round of redistricting, there were 7% more competitive races in 1992 than in 1990 and 8% more competitive races in 1994 than in 1990. In contrast, in the nine states where one party had the governorship but the legislature was split, there were 23% more competitive races in 1992 than in 1990 and 21% more competitive races in 1994 than in 1990.
Other findings of interest are:
Methodology
In phase 1 of the study, states were categorized into groups based solely on the partisan makeup of each state government when its congressional redistricting plan was adopted. The competitiveness of congressional elections in each group before and after redistricting was then compared. In phase 2, states were examined where a court influenced a plan or a commission adopted or drew one.
My key measure was change in the degree of competitiveness, given that this change would more accurately reflect the effect of redistricting. On the other hand, competitiveness in the 1990 elections likely was impacted by the prior redistricting in 1981-2 and deserves further research.
Phase 1: Analysis by Partisan Makeup
The study began with organizing each state into one of three categories based on the partisan makeup of the state's government when its redistricting plan was adopted: "monopoly states," in which one party controlled both chambers of the legislature and the governorship; "governorship states," in which one party had the governorship while the other party had both chambers; and "split states," in which one party controlled one chamber, the other party controlled the other chamber and either a Republican or Democratic was governor.
The twelve states which did not fit into one of these categories and are excluded are: states having one seat (Alaska, Delaware, Montana, North Dakota, South Dakota, Vermont and Wyoming); states with an independent governor (Connecticut), non-partisan legislature (Nebraska) or evenly divided state Senate (Idaho and Nevada); and states that did not redistrict before the 1992 election (Maine).
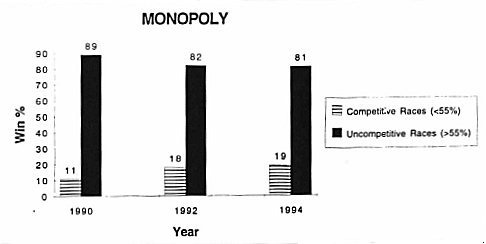
Monopoly States
There are 17 states in which one party controlled both chambers of the legislature and the governorship (or, as was the case in North Carolina, the governor from the other party had no veto power). With a total of 142 seats (up from 135 seats in the 1980s), these states are: Arkansas, Florida, Georgia, Hawaii, Kentucky, Louisiana, Maryland, North Carolina, New Hampshire, New Mexico, Oklahoma, Rhode Island, Tennessee, Texas, Utah, Virginia and West Virginia.
In monopoly states there were 7% more competitive races in 1992 than in 1990, and 8% more competitive races in 1994 than in 1990. The average increase in competitiveness after redistricting was 7.5%. These findings show that one-party control of state government results in less competitive districts after redistricting than one finds in states with divided government.
The likely explanation is partisan gerrymandering and protection of that party's incumbents, although it also may be that the electorate is strongly in favor of one party in monopoly states. It would be worthwhile to examine the ratio of votes won to seats won in monopoly states to discover whether controlling parties used strategies such as "packing" or "dispersion" to exaggerate their partisan advantage.
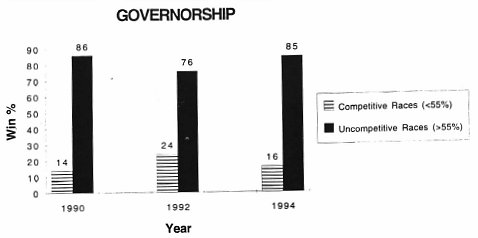
Governorship States
There are 12 states in which one party had the governorship while the other party had both chambers. With a total of 150 seats (up from 148 seats in the 1980s), these states are: Alabama, California, Colorado, Iowa, Illinois, Massachusetts, Minnesota, Missouri, Mississippi, New Jersey, South Carolina and Wisconsin.
In governorship states, there were 10% more competitive races in 1992 than in 1990, and 1% more competitive races in 1994 than in 1990. The average increase in competitiveness after redistricting was 5.5%.
As discussed below, court involvement in these states had an important impact on competitiveness: governorship states without court involvement actually saw a decrease in competitiveness. It may be that the courts became involved in the states in which the majority party in the legislature did not have enough power to override the governor's veto, which could mean that governorship states without court involvement were more like monopoly states.
It would be useful to examine further circumstances in these twelve states at the time of redistricting to determine whether the governor had any real power to influence the legislature which was controlled by the opposing party at the time of redistricting.
Another possible reason for seeing a decrease rather than an increase in competitive races in governorship states without court involvement is that these states had a relatively high percentage (19.6%) of competitive races in 1990 as compared to monopoly and split states, with much lower rates of competitiveness in 1990.
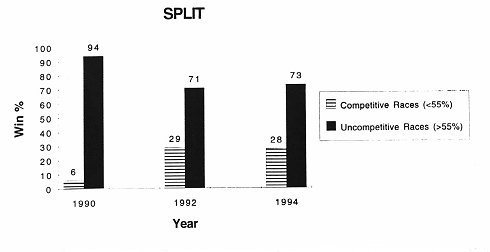
Split States
There were nine states in which one party controlled one chamber and the other party controlled the other chamber and either a Republican or Democrat was governor. With a total of 121 seats (down from 129 seats in the 1980s), these states are: Arizona, Indiana, Kansas, Michigan, New York, Ohio, Oregon, Pennsylvania and Washington.
In split states, there were 23% more competitive races in 1992 than in 1990, and 21% more competitive races in 1994 than in 1990. The average increase in competitiveness after redistricting was 22%.
Two split states that help point to key issues are New York and Ohio, as both states have been accused of writing incumbent protection plans. Although starting from a very low level of competitiveness, New York had an average 18% more competitive races and Ohio had an average 26.75% more competitive races after redistricting.
The increased competitiveness could be the result of New York losing 3 seats and Ohio losing 2 seats so that not all incumbents' districts could be preserved and all incumbents had to face bigger electorates. The average increase in competitive races after redistricting in states that lost seats was 13.45%, whereas, in states that gained seats, the average increase in competitive races was only 8.45%.
Another explanation may be that in states with split control, the electorate is in general more evenly divided, which results in closer races than would exist in states where one party is clearly dominant. However, this theory is not supported by these split states having such low levels of competitiveness (6%) in 1990.
Another factor could be that state legislators engage in less incumbent protection when they aspire to run for the House themselves, and a split state gives ambitious members from both parties a role in redistricting.
Courts and Commissions
Politicians in state government of course are not the only characters in the redistricting play. The trouble is, it is very difficult to ascertain who -- both in and out of government -- played what role. Were the courts directly involved? If not, did the possibility of court intervention influence the legislature and the governor (as in Massachusetts, where Democrats in the legislature acquiesced to Republican governor William Weld after his veto because they feared the potential involvement of a federal judge appointed by a Republican president)?
What of commissions responsible for drawing the lines; are they bipartisan or nonpartisan? How independent were the commissions of the politicians and their wishes?
Unfortunately, many redistricting tales are, to a considerable extent, unknown -- even to most residents of these states -- and will remain a mystery to all but the most ingenious sleuths. For that reason, the definitive meaning of the competitiveness figures for the three phase 1 groups of states is in question.
To attempt to gauge the impact of courts and commissions, the thirty-eight states studied were divided into groups based on whether the state legislature, a court or a commission had the final say on the redistricting plan that was adopted for the 1992 elections.
Court-Influenced States
Court-influenced states are states in which either the state or a federal court adopted the redistricting plan, although the role, purpose and degree of influence by courts varied from state to state.
Due to the variations in the degree of influence of the courts and the extreme difficulty encountered when attempting to measure that degree, readers may disagree about which states should have been included in this group. The nine court-influenced states in my study are: Alabama (governorship), Arizona (split), California (governorship), Florida (monopoly), Illinois (governorship), Michigan (split), Minnesota (governorship), Pennsylvania (split) and South Carolina (governorship). These states had a total of 153 seats in the 1980s and 159 seats in the 1990s.
In some states a court issued a plan of its own making. For example, in Michigan a court rejected plans submitted by both parties because they were "excessively partisan" and drew its own plan which was unkind to incumbents to the extent that five of the sixteen members elected in 1992 were challengers. Other courts appeared to be less willing to tread so far into the political thicket. In Florida, for example, the plan adopted by a federal court was drawn by a Tulane University professor.
Many of the court-influenced states had a complex sequence of redistricting events which altered the partisan balance of control over the process along the way. In Alabama, for example, the court adopted a plan proposed by Republicans after the Bush Administration's Department of Justice, citing Voting Rights Act violations, rejected the plan drawn by the Democrat-controlled state legislature. The threat of such intervention likely had an impact on Georgia, Louisiana, Mississippi, North Carolina, Texas and Virginia, all of which are among the nine states covered in entirety by the Voting Rights Act.
In California, which also had a Democrat-controlled legislature, a judicial commission appointed by the Republican governor drew the plans which were later adopted by a Republican-dominated state supreme court.
Several states, including Georgia, Louisiana and Texas, have not seen the end of court involvement in 1990s redistricting, but only Louisiana was forced to change its districts prior to the 1994 elections. The ongoing litigation in these states is the result of the 1993 North Carolina case Shaw v. Reno and ensuing debate over how to apply the federal Voting Rights Act.
Court-influenced states had 19.9 % more competitive races in 1992 than in 1990, but only 8.6% more competitive races in 1994 than in 1990. Therefore, the average increase in competitiveness after redistricting was 14.3%.
With regard to the effect of court involvement, it is notable that five of the nine court-influenced states were in the governorship group in phase 1 of the study. In phase 1, governorship states had an average 5.5% increase in competitive races after redistricting. After removing the five court-influenced states from the governorship group there was an average 1.4% decrease in competitive races in governorship states.
The findings indicate that when courts enter into the redistricting process they do have an impact measured by competitiveness of subsequent elections.
Commission States
Commission states are states in which a redistricting commission adopted the state's redistricting plan rather than the governor and state legislature. The three states in this category are Hawaii (monopoly), New Jersey (governorship), and Washington (split). These states had a total of 24 seats in the 1980s and the 1990s. The degree of the commissions' independence of state legislatures and governors varied from state to state just as the role of the courts varied in the court-influenced states.
In New Jersey, the legislature delegated redistricting authority to a thirteen member bipartisan commission, because they feared another Karcher conundrum and there was no time to pass a constitutional amendment to establish a commission. Only one of the thirteen members was required to be independent (defined as not having held elected public or party office in New Jersey at any time in the three years preceding appointment to the commission).
New Jersey Democrats agreed to leave redistricting to the commission because they failed to reach an agreement in 1991, when they had monopoly control, before losing the state House and Senate to Republicans who gained veto-proof control and could repeal any plan the Democrats drew as lame ducks. The Republicans agreed because they assumed that they would come out better than Democrats due to their growing popularity among the electorate.
Hawaii also created a bipartisan commission to come up with a plan, but its redistricting was uneventful with only very minor changes in the two districts.
Washington's use of a redistricting commission was constitutionally mandated and, unlike those in New Jersey and Hawaii, was nonpartisan; no elected officials could be on the commission. However, a plan adopted by the commission in Washington can be amended by a two-thirds majority vote of the state House and Senate. At the request of the commission, the legislature did amend the commission's 1990s plan in order to ensure strict population equality, but only very slight changes were made.
Commission-influenced states had 0% more competitive races in 1992 than in 1990, but 8.3% more competitive races in 1994 than in 1990 and 1992. Therefore, the average increase in competitiveness after redistricting was 4.2%.
Although it is surprising that commission-influenced states would show no increase in competitiveness from 1990 to 1992 and an average increase of only 4.2%, there are some possible explanations. The two most notable observations are: (1) this is a small sample -- 3 states with 24 seats; (2) these three commission-influenced states started with 25% competitive races in 1990 whereas other categories had much less competitive races that year. One further explanation could be that the commissions in Hawaii and New Jersey were bipartisan, not non-partisan.
Suggestions for Future Study
Many significant questions remain unanswered. For example, more study is warranted on the impact of the requirement of Voting Rights Act compliance in states covered by the Act, particularly given that many southern states were controlled by Democrats and the U.S. Justice Department in charge of enforcing the Act was part of a Republican administration.
Another issue is the question of what happened in the 1980 round of redistricting. Given that the two groups that had the greatest increase in competitiveness after 1990 also had the greatest percentage of uncompetitive races in 1990 (for example, court-influenced states had only 8% competitive races in 1990, and split states had only 6% uncompetitive races), it would be helpful to know what factors might have influenced redistricting in those states in the last redistricting.
Other questions include whether the results correspond for state legislative redistricting in these states and whether choosing different measures of competitiveness would affect the results.
Whatever the answer to these questions, this analysis demonstrates the likely impact of partisan control of redistricting and where voters may need to be most vigilant in the next redistricting cycle.
Sheryl Seckel is a 1995 graduate of the Georgetown Law Center. Rob Richie of The Center for Voting and Democracy and Professor Roy Schotland of Georgetown Law Center provided advice during the research for this project.