|

|
Arizonaís 1st
- southeastern Phoenix
- Republican
- 1992 redistricting purged the 1st of two heavily
minority, Democratic areas
- population is historically Mormon and increasingly retired
- 87% white; 3% black; 2% Asian; 13% Hispanic; 2% Native Amer.
|
|
|
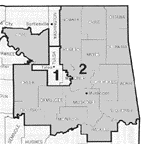
Oklahomaís 2d
- Northeast
- foothills of the Ozarks; poor and rural
- leans Democratic, but Republicans can win due to the influence
of the Christian Coalition
- 77% white; 5% black; 17% Native American; 1% Hispanic
|
|
|
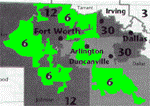
Texasí 6th
- suburban Dallas; part of Ft. Worth, part of Arlington
- Republican, though part of the district is socially moderate
- 90% white; 5% black; 2% Asian; 6% Hispanic
|
|
|
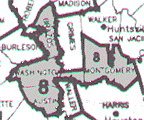
Texasí 8th
- Northern Houston suburbs; College Station
- Republican (Texas A&M is a conservative college)
- 90% white; 5% black; 2% Asian; 7% Hispanic
|
|
|
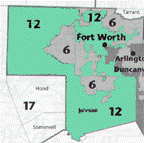
Texasí 12th
- northwest Tarrant Co.; part of Ft. Worth
- mostly white, middle-class; mixture of suburban and rural
- competitive, leaning Republican
- 75% white; 23% black; 1% Asian; 1% Hispanic
|
|

|
Texasí 15th
- Southern Texas
- one of the poorest districts in the nation
- includes Texasí largest Hispanic population
- Democratic (the 15th seat has never gone to a
Republican)
- 25% white; 1% black; 74% Hispanic
|
|

|
Texasí 21st
- South Central
- odd shape reflects the 1992 districting desire to separate
Democratic and Republican neighborhoods to allow the 21st
to be Republican
- 91% white; 3% black; 1% Asian; 14% Hispanic
|
|
|
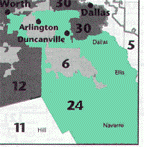
Texasí 24th
- parts of Dallas and Tarrant counties
- leans Democratic
- 1992 redistricting increased the Democratic tilt
- 64% white; 20% black; 2% Asian; 21% Hispanic
|
|

|
Texasí 25th
- south Houston and suburbs
- one of the few swing districts in the Houston area
- voters tend to be fiscally conservative but socially progressive
- 63% white; 23% black; 4% Asian; 18% Hispanic
|
|
|
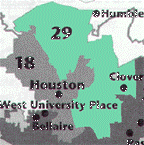
Texasí 29th
- Southeastóparts of Houston, Pasadena
- blue-collar, working class district
- originally created as a Hispanic-majority district, but then
Hispanics were moved out of the district
- one of the poorer Texas districts, with a low percentage of
college-educated residents
- 58% white; 15% black; 2% Asian; 45% Hispanic
|