|
|
|
| . | . | ||||
 |
 |
||||
North Carolina:
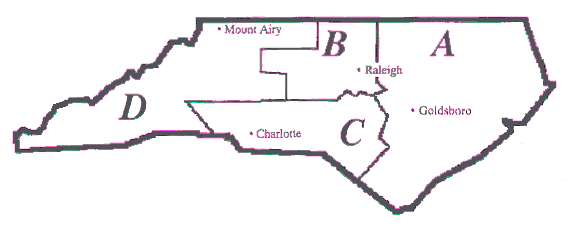
What PR super districts might look like
|
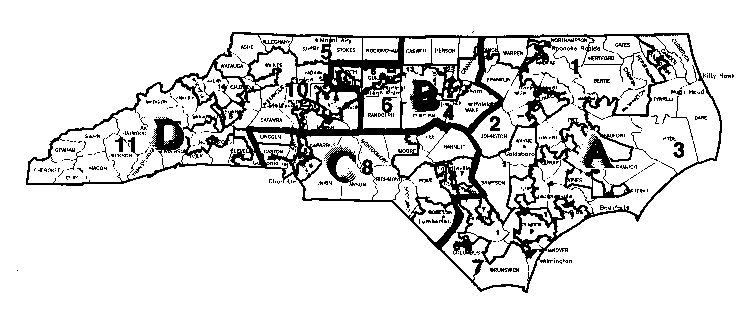
This map is an example of how full representation voting systems -- such as choice voting, one-vote voting and cumulative voting � can be vehicles for providing fair representation for black voters. Twelve old U.S. House districts have been replaced by four larger "super districts" A, B, C, and D. The voting-age-populations (VAP) and black share of these populations are shown below the map. The percentage of votes necessary to win is based on use of a full representation voting system. Note how a state with currently one black-majority district and one black House member might easily have three black members with this plan. In 1967,Congress passed a law requiring states to use one-seat U.S. House districts. This year, Congressman Mel Watt has introduced a bill called the States' Choice of Voting Systems Act (HR 1173) which would lift this requirement. Similar super-district plans could be used for local and state redistricting plans in 2001-2. |
 |
| Eastern District A 3 seats |
Northern District B 3 seats |
|
| Population: | 1,645,672 | 1,655,100 |
| Population per seat: | 548,557 | 551,700 |
| Winning Percentage: | 25% | 25% |
| Non-white % of VAP: | 31% | 25% |
| Voting Rights Analysis: |
Black voters could elect a candidate of choice. |
Black voters could elect a candidate of choice. |
| Southern District C 3 seats |
Western District D 3 seats |
|
| Population: | 1,667,658 | 1,660,207 |
| Population per seat: | 555,886 | 553,402 |
| Winning Percentage: | 25% | 25% |
| Non-white % of VAP: | 27% | 9% |
| Voting Rights Analysis: |
Black voters could elect a candidate of choice. |
Black voters could elect a candidate with support of white voters. |
