|
|
|
| . | . | ||||
 |
 |
||||
Illinois:
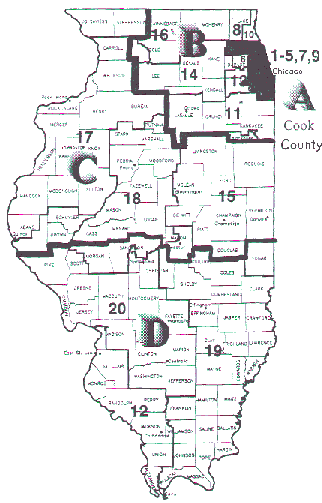
What PR super districts might look like
|
This map is an example of how full representation voting systems -- such as choice voting, one-vote voting and cumulative voting � can be vehicles for providing fair representation for black and Latino voters. Existing U.S. House districts, numbered 1 through 20, have been combined into four larger "super districts", A, B, C, and D. The voting-age-populations (VAP) and black share of these populations are shown below. The percentage of votes necessary to win is based on use of a full representation voting system. In 1967,Congress passed a law requiring states to use one-seat U.S. House districts. This year, Congressman Mel Watt has introduced a bill called the States' Choice of Voting Systems Act (HR 1173) which would lift this requirement. Similar super-district plans could be used for local and state redistricting plans in 2001-2. |
 |
|
For more information, contact:
The Center for Voting and Democracywww.fairvote.org
[email protected]
301-270-4616
![]()