|
|
||
|
Massachusetts |
|
|
||
|
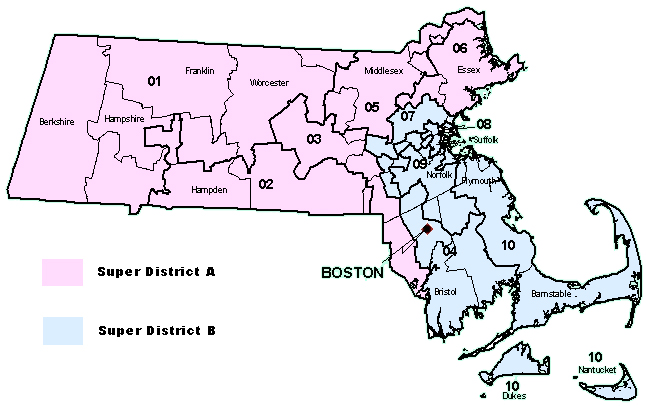
| SUPER DISTRICT A - FIVE SEATS | ||||||||||
|
2000 Presidential Vote |
% Black | % Latino | ||||||||
| State | CD | Bush | (%) | Gore | (%) | Other | (%) | Total | Origin | Origin |
| Massachusetts | 1 | 88690 | (33.2%) | 150418 | (56.4%) | 27700 | (10.4%) | 266808 | 1.6% | 6.3% |
| Massachusetts | 2 | 89775 | (34.6%) | 150148 | (57.9%) | 19588 | (7.5%) | 259511 | 5.5% | 9.2% |
| Massachusetts | 3 | 90375 | (34.6%) | 153044 | (58.6%) | 17711 | (6.8%) | 261130 | 2.6% | 6.0% |
| Massachusetts | 5 | 93406 | (36.3%) | 145277 | (56.5%) | 18433 | (7.2%) | 257116 | 1.7% | 11.6% |
| Massachusetts | 6 | 107415 | (35.7%) | 172840 | (57.4%) | 20760 | (6.9%) | 301015 | 1.9% | 4.4% |
| Total | 469661 | (34.9%) | 771727 | (57.4%) | 104192 | (7.7%) | 1345580 | 2.6% | 7.4% | |
| Winning Percentage: | 16.7% | |||||||||
| Voting Rights Analysis: | Minority voters supporting a candidate with crossover appeal could, in coalition with white voters, elect a candidate of choice. | |||||||||
| District Partisanship: | 59.0% | This super district would likely elect three Democrats and two | ||||||||
| Republicans. | ||||||||||
| SUPER DISTRICT B - FIVE SEATS | ||||||||||
|
2000 Presidential Vote |
% Black | % Latino | ||||||||
| State | CD | Bush | (%) | Gore | (%) | Other | (%) | Total | Origin | Origin |
| Massachusetts | 4 | 79201 | (28.7%) | 178354 | (64.7%) | 18067 | (6.6%) | 275622 | 2.0% | 3.3% |
| Massachusetts | 7 | 82250 | (28.9%) | 181417 | (63.8%) | 20891 | (7.3%) | 284558 | 3.3% | 4.8% |
| Massachusetts | 8 | 28903 | (14.8%) | 142500 | (73.2%) | 23374 | (12.0%) | 194777 | 21.9% | 15.9% |
| Massachusetts | 9 | 93529 | (33.4%) | 167059 | (59.7%) | 19051 | (6.8%) | 279639 | 8.1% | 4.6% |
| Massachusetts | 10 | 124956 | (38.7%) | 175426 | (54.3%) | 22722 | (7.0%) | 323104 | 1.5% | 1.3% |
| Total | 408839 | (30.1%) | 844756 | (62.2%) | 104105 | (7.7%) | 1357700 | 6.3% | 5.2% | |
| Winning Percentage: | 16.7% | |||||||||
| Voting Rights Analysis: | Minority voters supporting a candidate with crossover appeal could, in coalition with white voters, elect a candidate of choice. | |||||||||
| District Partisanship: | 63.8% | This super district would likely elect three Democrats and two | ||||||||
| Republicans. | ||||||||||
|
This proposal is based on the current congressional districts of Massachusetts. Because current congressional districts are often the results of gerrymandering, the proposed super district boundaries are not as smooth and nice-looking as they could be in a similar proposal that made use of sub-congressional district data. |