


The Gerrymander and Money Myths
The Real Roots of Non-Competition & GOP Advantage
After four decades of control of the U.S. House of Representatives, usually by overwhelming margins, some Democrats may have developed a sense of entitlement about running the House. When Republicans took control in the 1994 elections, it was not hard for these Democrats to point their fingers at culprits other than themselves for their defeats, including alleged Republican advantages won in redistricting and strategic campaign spending or untrustworthy voting machines. These perceptions were fueled by reformers eager to seize on an opportunity to make their case for reform. Some showcased data that suggested money determines the outcomes in more than 90% of House races, while others focused on how new techniques for partisan gerrymandering were the biggest contributing factor to declines in electoral competition and increases in the general Republican advantage.
There is an element of truth to these claims. Certainly our antiquated mechanics of running elections result in literally millions of lost votes in national elections, congressional candidates would rather have more money to spend than less, and partisans would not wage such bitter political and legal fights over redistricting if they did not recognize its power to affect electoral outcomes. But FairVote challenges the underlying argument that either campaign spending or gerrymandering is the major reason for either the remarkable levels of non-competition in U.S. House races or for recent Republican advantages.
It’s not the money: Our intensive examination of the 2000 election cycle
Because winning House races is strongly correlated with campaign spending and outspending one’s opponent, in particular, some observers are quick to mistake cause for effect when it comes to money’s place in U.S. House elections. Money flows to candidates for a variety of reasons that have nothing to do with helping them win elections; in fact, many of the biggest campaign donors prefer to give to candidates whom they expect to win, as certain winners are a better investment for those wanting future access to address policy concerns. Of course, in today’s heated battle for control of Congress, competitive races draw more attention from donors on both sides of the partisan divide. As FairVote demonstrated in 2002, the result is that winning percentages in House races are actually negatively correlated with the campaign spending by both winners and losers. In other words, as a candidate spends more and more money, he or she tends to win by smaller and smaller amounts.
For indications that much money isn’t being given just to defeat candidates of another party, take two examples from 2000: Pennsylvania-9’s Bud Shuster, who spent more than $1.1 million that year, and Arkansas-3’s Asa Hutchison, who spent more than $800,000. Their spending levels were above average but otherwise unremarkable – except that both candidates were uncontested and won election with 100% of the vote, safely ensconced in districts secure for their party. Clearly, in these and many other cases, their contributors were betting on a sure thing.
On the other hand, there are many races where the candidates spent similar amounts, but the winner won by more than 20%. Examples from 2000 included Steve Buyer (IN-5), whose opponent spent over $400K compared to Buyer’s $330K; Patsy Mink (HI-2), where both candidates spent around $200K; and Tom Allen (ME-1), where Allen and his opponent spent a little more than $350K.
There were three House races that year in which both candidates spent more than $2 million. The candidate who spent more money lost two out of three. Four out of the top five biggest spending losers outspent their opponents. Ten candidates spent more than $2 million in 2000. Five won, and five lost. Of the five losers, four of them outspent their opponents but lost anyway. If spending really determined the outcome of every race – not just who won but by how much – then one would expect to find competitive races when candidates spend similar amounts and lopsided races when one candidate outspends the other. This turns out not to be the case. Instead, the winner and winning percentage is far more closely correlated with the partisanship of the district, which is determined long before candidates start raising and spending money. Here are more examples from the 2000 elections:
• NC-3: Republican Walter Jones, Jr. and his opponent both spent about $1.1 million, yet Jones crushed his opponent with 61% of the vote. Without using any information on campaign finance, our model projected that Jones would win with at least 60%.
• IN-3: Democrat Tim Roemer was outspent by his Republican opponent by more than $250,000 but won with 52% of the vote, within 1% of our projection.
• OK-6: Republican Frank Lucas was outspent by his Democratic opponent yet ended up within 2% of our projection and won by over 18%.
If money doesn’t determine the outcome of races as much as the fundamental political landscape of voters, some might suggest that media coverage does. To show that this is not the case in most Congressional elections, consider two adjacent districts with very different partisan compositions. Two such districts are AL-6 (Spencer Bachus) and AL-7 (Earl Hilliard). Voters in these two districts were exposed to identical media coverage of the presidential election, yet Bill Clinton in 1996 received 45% more of the vote in Hilliard’s district than in Bachus’ district. Four years later, with two very different candidates and presumably different strategies in the state, Al Gore won 44% more of the vote in Hilliard’s district than in Bachus’. Just like their party standard-bearers, in each of their last 4 elections, both Bachus and Hilliard won with landslide margins of over 40%, just as our model predicts based on the partisanship of the district.
Finally, although outspending one’s opponent is certainly associated with winning elections and winning percentage, the association between winning percentage and partisan prediction is much tighter than between winning percentage and the winner’s spending ratio in the 2000 open seat races for which we were able to obtain campaign finance data for both candidates.
It’s not gerrymandering: The roots of non-competition run far deeper
With rising rates of incumbent retention, lopsided elections and the visceral impact of the Texas re-redistricting in 2003 suggesting to Democrats that Republicans can steal elections through gerrymandering, redistricting processes have drawn increasing attention from reformers and editorial writers. But the bracing reality is that political gerrymandering in 2001-2 only had a minimal impact on overall lack of competition and is not the root cause of the bias toward Republicans that exists in congressional districts. Consider these points:
- Our elections have been non-competitive for decades, starting well before modern tools of gerrymandering emerged and even before states regularly redistricted at the start of a decade. In 1956, for example, 96% of incumbents won and 95.4% of seats stayed in the same party’s hands; indeed at least 88% of incumbents won in every election since 1952, including 99% in 1968, 97% in 1976 and more than 98% in both 1986 and 1988 – years when more than 85% of all incumbents won by margins of more than 20%.
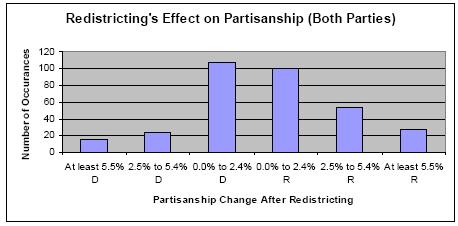
- It is true that we are in the midst of the least competitive congressional elections in history, and certainly one can measure specific means by which certain incumbents were protected in 2001-2002. But the great majority of incumbents did not need nor receive any help in redistricting. As the chart at the end of this analysis shows, the great bulk of districts were changed by less than 2.5% in partisanship in post-2000 redistricting – 207 out of 326 that we analyzed. Another 77 districts had their partisanship shift by between 2.5% and 5.5%, but only 42 districts were changed by more than 5.5%, which is the only kind of change that alone could turn a competitive race into a landslide win. Yet even in these 42 districts, only 27 of the partisan shifts in redistricting helped the incumbent party.
- The sharpest decline in competition occurred after the 1996 elections, when no redistricting was happening. The combination of the Cold War ending in 1989, Bill Clinton winning the presidency in 1992 and Republicans taking over the House in 1994 led to a hardening of partisan voting patterns in federal races that contributed to the Republican win in 1994 and a modest Democratic comeback in 1996. But by 1998, the field of play was generally set, with a sharp decline in incumbents representing the opposition party’s district. That year, one in which the impeachment of Bill Clinton only further polarized the country, only six House incumbents lost, and fewer than 10% of races were won by less than 10%. We have experienced single-digit incumbent defeat numbers ever since, and the number of races won by less than 10% have never dropped to fewer than nine in ten races. It is true that redistricting typically would have created an upward blip in competition in 2002, but even such a temporary increase in competitive races would have had a minor impact on the overall problem of lack of voter choice.
- The same dramatic drop in competition has taken place in states in presidential contests decided by the Electoral College – moving from 24 states being in a swing state position in 1976, representing 345 electoral votes, to just 13 similarly defined swing states representing 159 electoral votes in 2004. State lines of course are not redrawn, and major party presidential candidates have great access to the media and to campaign dollars – but none of those factors have stopped the decline in competitive states. FairVote’s report Presidential Election Inequality, available in hard copy and on-line at www.fairvote.org/presidential, helps shows just how and why this has occurred.
- Republicans have a definitive edge in the number of districts their presidential candidate carries in a nationally even year, but that edge has in fact declined since the 1970s. Their past advantage was obscured by the fact that so many House Democrats before 1994 were able to represent Republican-leaning districts, but a single-member district’s bias against the party whose support is more concentrated is nothing new. See the chart at the end of this factsheet.
Even if commissions typically are a worthy reform to address the conflict of interest that comes with politicians helping their political friends and hurting their enemies, independent redistricting alone will never achieve a complete set of worthy public interest goals at the same time: competitive elections, partisan fairness, racial fairness, geographic coherence and accountable leadership.
Competition, for example, requires districts with a narrow partisan division, which in turn almost certainly means that racial minorities will not have the power to consistently elect candidates of choice as required under the Voting Rights Act. Competitive districts also pave the way for wild shifts in party balance despite only small statewide shifts in the vote balance. And given that most areas have natural partisan leanings, drawing competitive districts makes it difficult to follow traditional criteria like compactness and maintenance of local political lines.
In part due to these inherent conflicts, independent redistricting has had minimal impact on electoral competition and, at best, mixed impact on fair partisan, racial and gender representation. Arizona and Iowa are often highlighted by redistricting reformers for having adopted independent redistricting for congressional and state legislative elections, but neither state has particularly competitive elections nor the increased accountability and fairer representation sought by most reformers. In Arizona, for example, 15 of 16 U.S. House races were won by landslide margins of more than 20% in the first two elections since independent redistricting in 2001, and no incumbent has come close to losing. None of its 30 state senate seats were competitive in 2004; indeed almost half were not even contested.
Even though Iowa is almost uniquely balanced in its partisan division across much of the state, all of its U.S. House incumbents in 2004 were re-elected, with an average margin of victory of 18%. Iowa’s incumbency rate in fact has been more than 97% since the adoption of independent redistricting. In addition, no woman has been elected to Congress in either Iowa or Arizona since adoption of independent redistricting, and women candidates have fared less well in state elections held after each round of independent redistricting in those states. Arizona Latinos sued their state plan, which has been in continuous litigation since 2002. The reality is that voter choice and fair representation are mutually exclusive in a single-member district, even with independent redistricting. The partisan imbalance within different areas of most states makes it impossible to draw districts that are both reasonably shaped and at the same time competitive.
The root cause: A combination of incumbency, winner-take-all elections and hardening partisanship
As we look at how strikingly non-competitive House elections have become, we must confront the fact that by far the most important factor is that the U.S. House is elected in winner-take-all, single-member districts. Winner-take-all elections held with plurality voting rules tend to limit general elections to candidates from two parties. Given that the great majority of geographically-defined areas in the nation show clear preference for one party over the other, most incumbents have virtually a free ride because their party is preferred in their district. Even in those relatively few districts that are more balanced between backers of the major parties, incumbents can use a variety of advantages that come with their office – such as being quick to respond to constituents’ non-partisan needs, sending out regular free mail to district voters, raising large sums of money – to make their defeat nearly impossible without exposure of personal corruption or a major national partisan shift.
Recent years have exaggerated the problem of lack of competition for several reasons: (1) incumbents and parties are more sophisticated about what incumbent officeholders should do in serving their district to shield themselves from competition; (2) new computerized methods of redistricting, combined with the need to draw new districts every ten years and the lack of nonpartisan standards governing the process, increasing the number districts with apartisan tilt; (3) those partisan tilts are more decisive than ever because the national parties have become quite distinct in most voters’ minds, leading to less ticket-splitting.
The end result is that most voters don’t have a choice between two candidates, let alone three – so much for a healthy two-party system, where issues ignored by one major party can be meaningfully addressed by the other one. If voters would like to hear about the policy ideas of independent and third party candidates, they’ are even more shut out. Yes, voter turnout is down over recent decades, but we believe it is time to stop blaming the victims of the American electoral system – the voters – and start addressing the root causes of alienation and lack of representation: our winner-take-all electoral system, buttressed by incumbent privileges and, yes, campaign cash and partisan redistricting run amok.
Reform Lessons from Partisan Voting Patterns in U.S. House Races, 1972-2002
If one studies the shifting district partisanship in congressional districts over recent decades, two trends stand out:
• Republican presidential candidates consistently run ahead of their national average in a large majority of districts (that measure is the consistent one we use to determine whether a district has a Republican bias or Democratic national bias.)
• Democratic Party dominance of districts with a Democratic bias has been relatively consistent over time – and the total number of such seats in fact has increased. Republican growth in House seats has come heavily in seats with a Republican bias.
We believe these facts support our contention that much of the behavior of legislators in Congress and the greater entrenchment of more incumbents are founded on the parties becoming more distinct and on voters voting more on national perceptions of the parties.
Because most congressional district-sized geographic areas have clear partisan tilts, then most congressional districts are going to be non-competitive no matter how the district lines are drawn. Redistricting reform certainly could make an incremental improvement in competitive choice, but potentially at a cost to representation of racial minorities. In contrast, by adopting a version of the Illinois model for electing its state house of representatives used from 1870 to 1980 (a non-winner-take-all system in three-seat legislative districts), nearly every three-seat constituency would have two-party representation as well as competition within parties in the general election. Representatives would cover the left, center and right of the spectrum in greater balance than now. Racial minorities would have opportunities to elect seats in more areas of the nation, and women would be more likely to run and win. Instructively, in 2001, a bipartisan panel in Illinois led by former Congressman Abner Mikva and former Illinois Governor Jim Edgar recommended restoring the Illinois model in order to achieve better elections and governance.
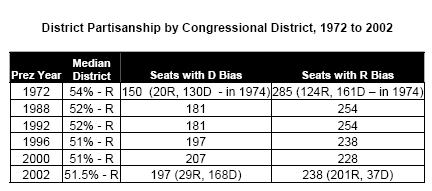
Note: Partisanship of districts is determined by the relative performance of major party presidential candidates in a district as compared to their national average. The median district refers to the partisan tilt of the 217th district in order of partisanship. The number of seats in parentheses in 1972 and 2002 refers to the number held by Republicans and Democrats in that category.