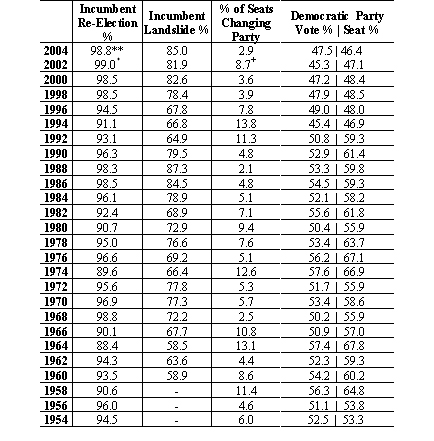
Summary Table

**5 incumbents lost to non-incumbent challengers in 2004. 2 other incumbents lost to other incumbents in races that pitted 2 incumbents against each other as a result of redistricting. 98.2% represents 395 wins out of 400 races.
* 4 incumbents lost to non-incumbent challengers in 2002. 4 other incumbents lost to other incumbents in races that pitted 2 incumbents against each other as a result of redistricting. 99.0% represents 382 wins out of 386 races.
+ Due to reapportionment, 8 states gained seats and 10 lost seats. Those gains and losses contributed to 24 seat changes. Another 14 seats switched from 1 party to the other.