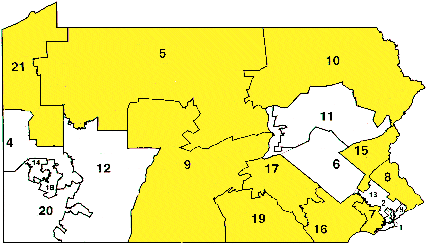
Pennsylvania
21 seats: 11R, 10D

Where It Ranks Among the States (House Elections 2000)- Voter Turnout: 25th (50%)
- Victory Margin: 35th (42%)
Facts in Focus- The average margin of victory in Pennsylvania's
U.S. House races was 42%. This was a continuation of
the results in 1998, which were slightly wider than in 1992 and 1994, and
much wider than the average margin of 30% in 1996. Still, 21 states
had higher average victory margins in 2000.
- 81% of Pennsylvania's U.S. House races were won
by landslide margins of at least 20% in 2000.
This is a continuation of the results in 1998, which were the highest
"landslide index" in Pennsylvania since 1988, when 91% of seats were
won by landslide.
- Incumbents have won 176 of their last 181
re-election bids in U.S. House races in
Pennsylvania.
- 66% of adults in Pennsylvania in 2000 did not
vote for the person who represents them in the U.S. House.
- The statewide vote for Republican and
Democratic House candidates in 2000 nearly mirrored the state's
partisan split, although Republican won a majority of seats with
fewer votes than Democrats candidates. The state's seat-to-votes
distortion has been very small throughout the
decade.
- For the first time since 1994, a woman candidate won a house race in
Pennsylvania. Men also won all 115 races in 1982-1990, meaning that a
woman has served just one term in the last 19
years.
- 17 incumbents repeated their landslide wins in
2000. Six incumbents have won landslide wins in 1992-2000.


How
Pennsylvania ranked in 2000

|