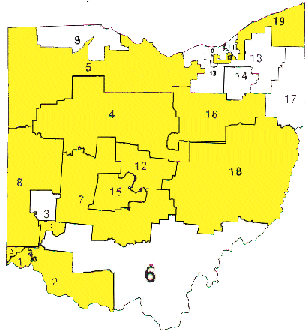
Ohio
19 seats: 11R, 8D

Where It Ranks Among the States (House Elections 2000)- Voter Turnout: 17th (54%)
- Victory Margin: 31st (39%)
Facts in Focus- The average margin of victory in Ohio's U.S.
House races was 39% -- meaning a typical House race was won by a
margin of more than two-to-one.
-
84% of House races in Ohio in 2000 were
won by landslide margins of 20% or more, which follows the trend of
high landslide margins set in 1998.
- Less than two out of five adults in Ohio
voted for the person who represents them in the U.S. House in 2000.
- No House races were decided by less
than 5% in 2000, and only two races by less than 10%.
In 1992-1996, an average of three races per year were won by less
than 5%.
- 11 of 18 incumbents are "untouchables" who have
won their last two races by landslide. Eight of these incumbents
have won landslide wins in each election in the 1992-2000 period.
Incumbents were even more entrenched in the 1980s; in 1988, 18 out
of 20 incumbents were untouchables who had won consecutive landslide
wins.


How
Ohio ranked in 2000

|